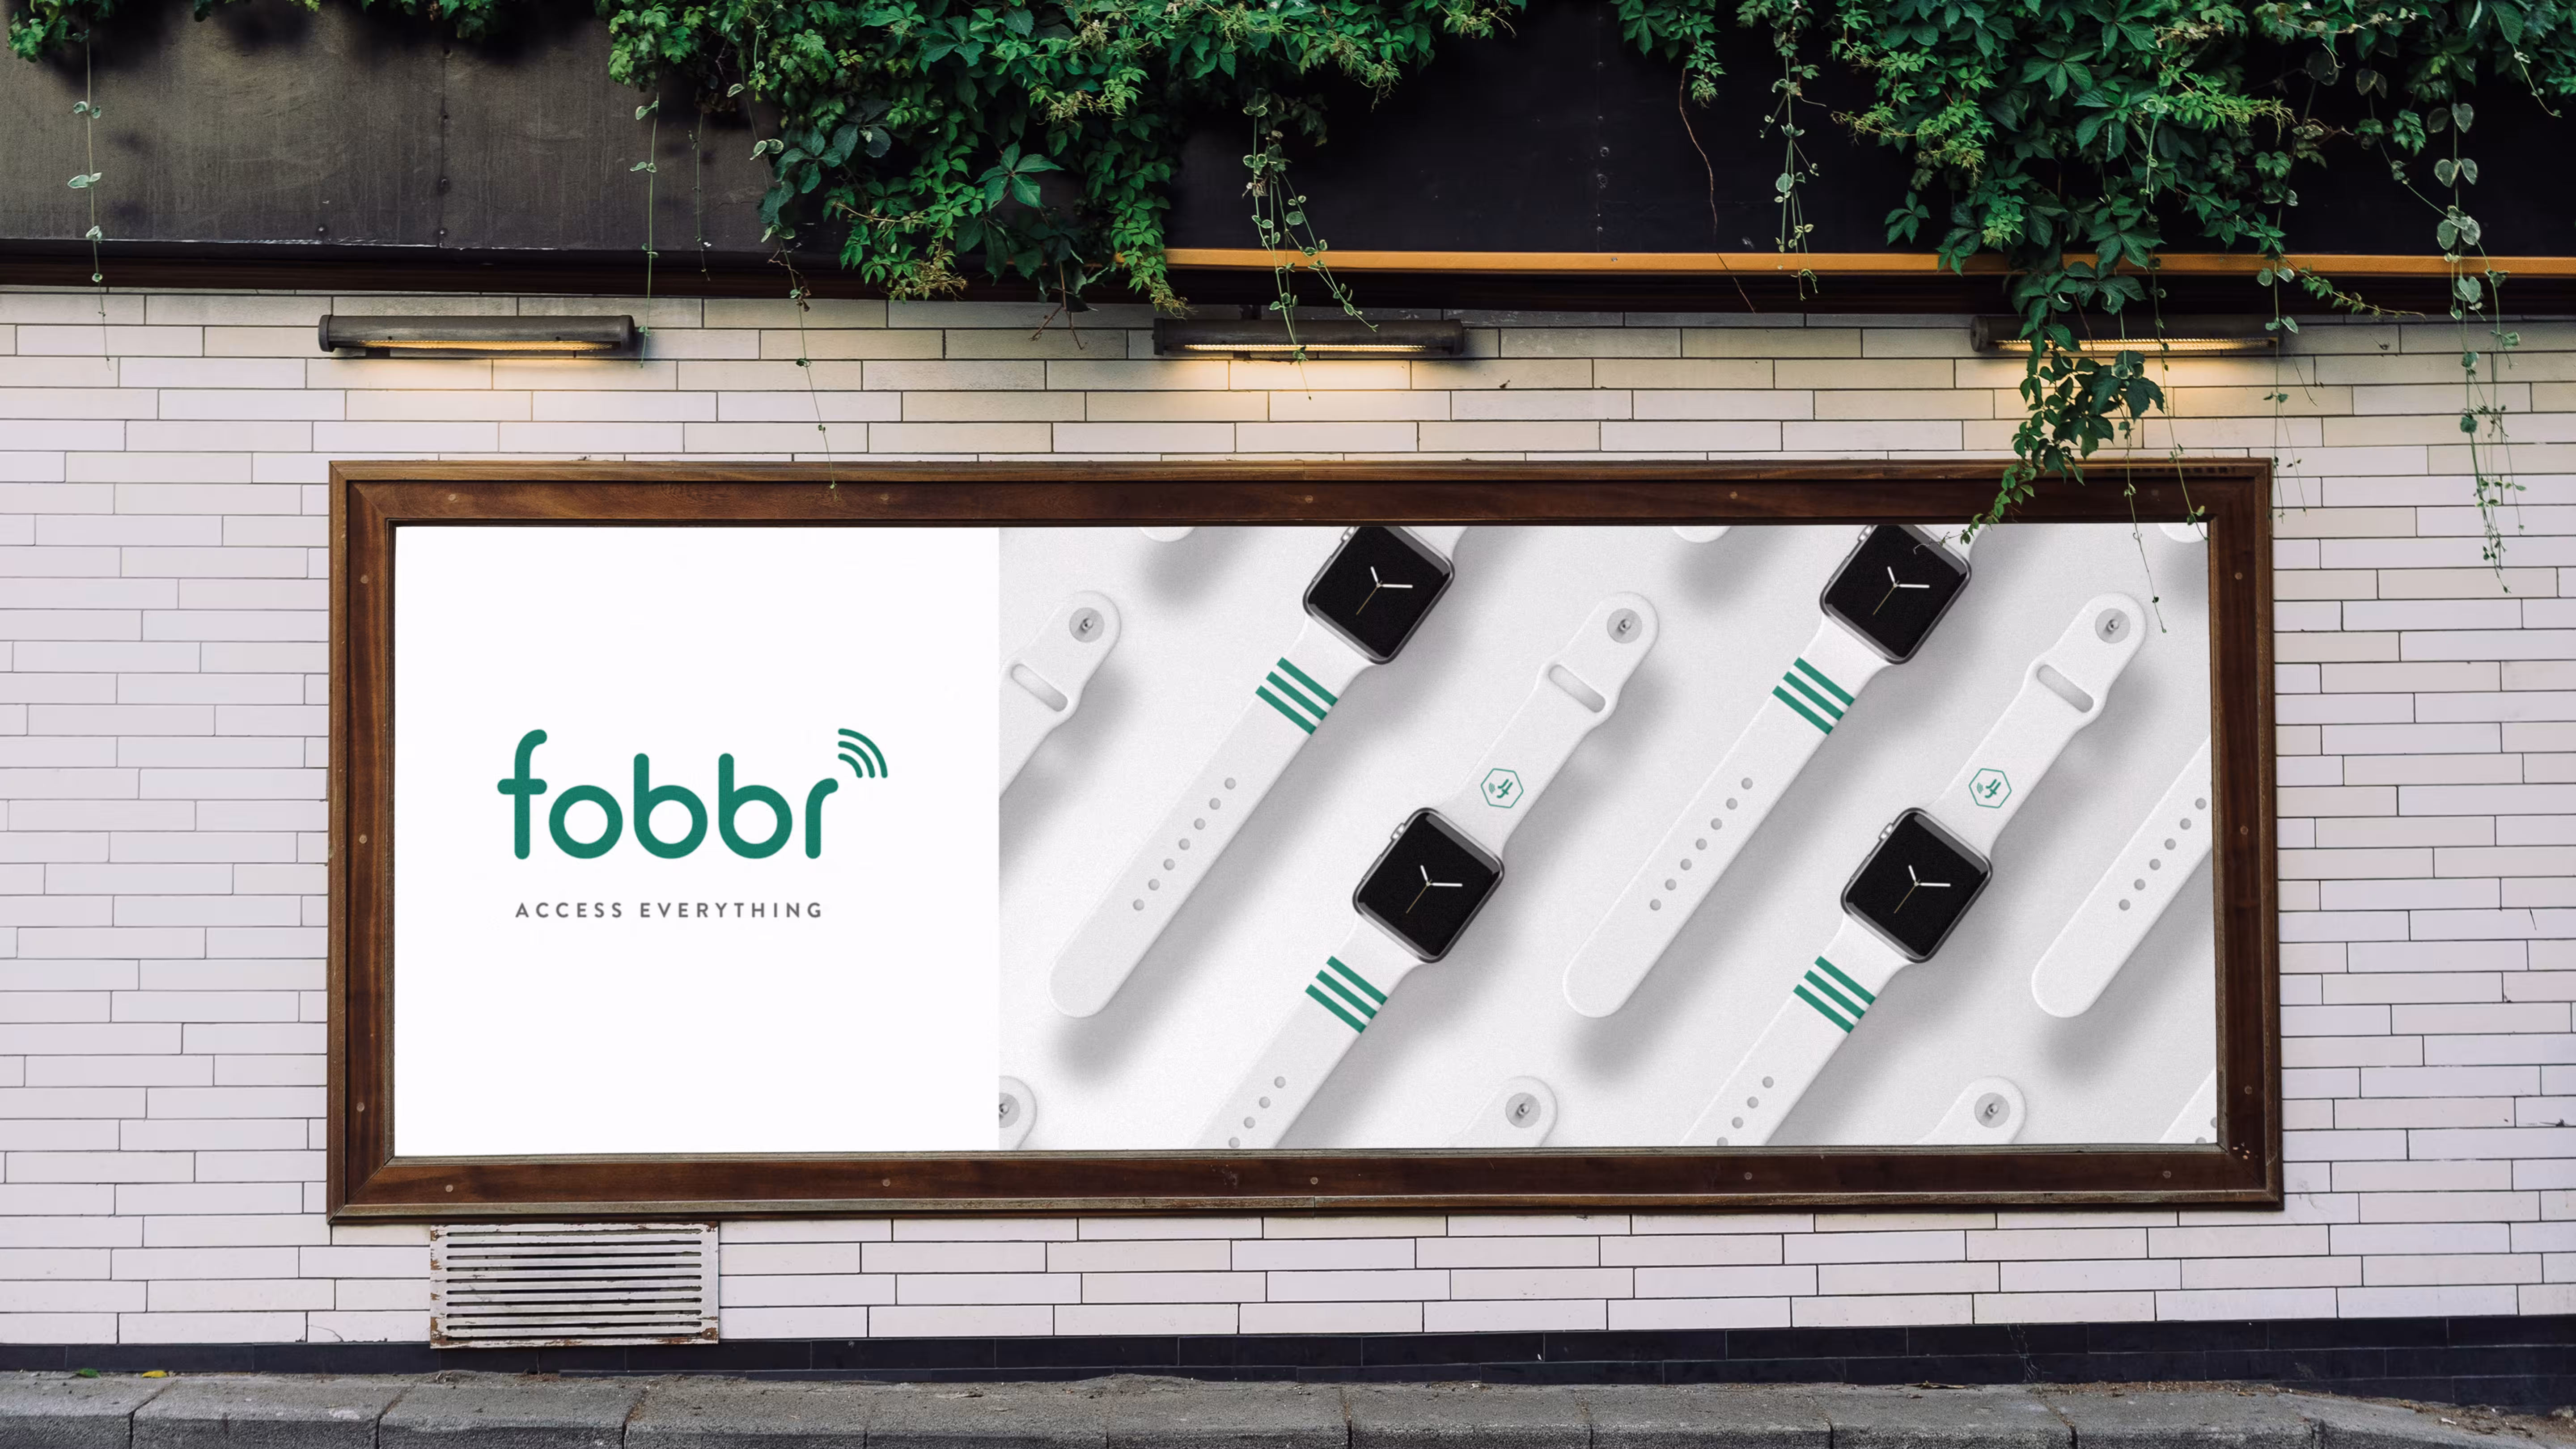
fobbr
"I don't carry my elevator keys anymore and wear my [Apple] Watch every day." — fobbr beta tester
46.2
NPS (beta study)
40
Bands built by hand
Create-X
Incubator
2 years
Duration
Your wrist already pays for your coffee, tracks your run, and buzzes with your messages — all without you reaching for a thing. Your apartment door and office elevator still make you stop and dig a plastic fob out of your pocket.
My Role
Co-founder and sole designer-researcher. Product vision, industrial design, user research methodology, pricing strategy, brand identity. Co-founded with Carl Demolder (ME, Georgia Tech).
The Friction
Every door is a small negotiation with your pockets
Watch someone reach their apartment gate: coffee in one hand, phone in the other, a bag on the shoulder — and the fob for the door buried in a pocket they can't get to.
I started fobbr with Carl Demolder by watching that moment repeat: hands full at the gate, the fob misplaced again, the jog with nowhere good to carry a key. The pain was never dramatic. It was constant, low-grade, and everywhere — the kind of friction people stop noticing because they've decided it's just how doors work.
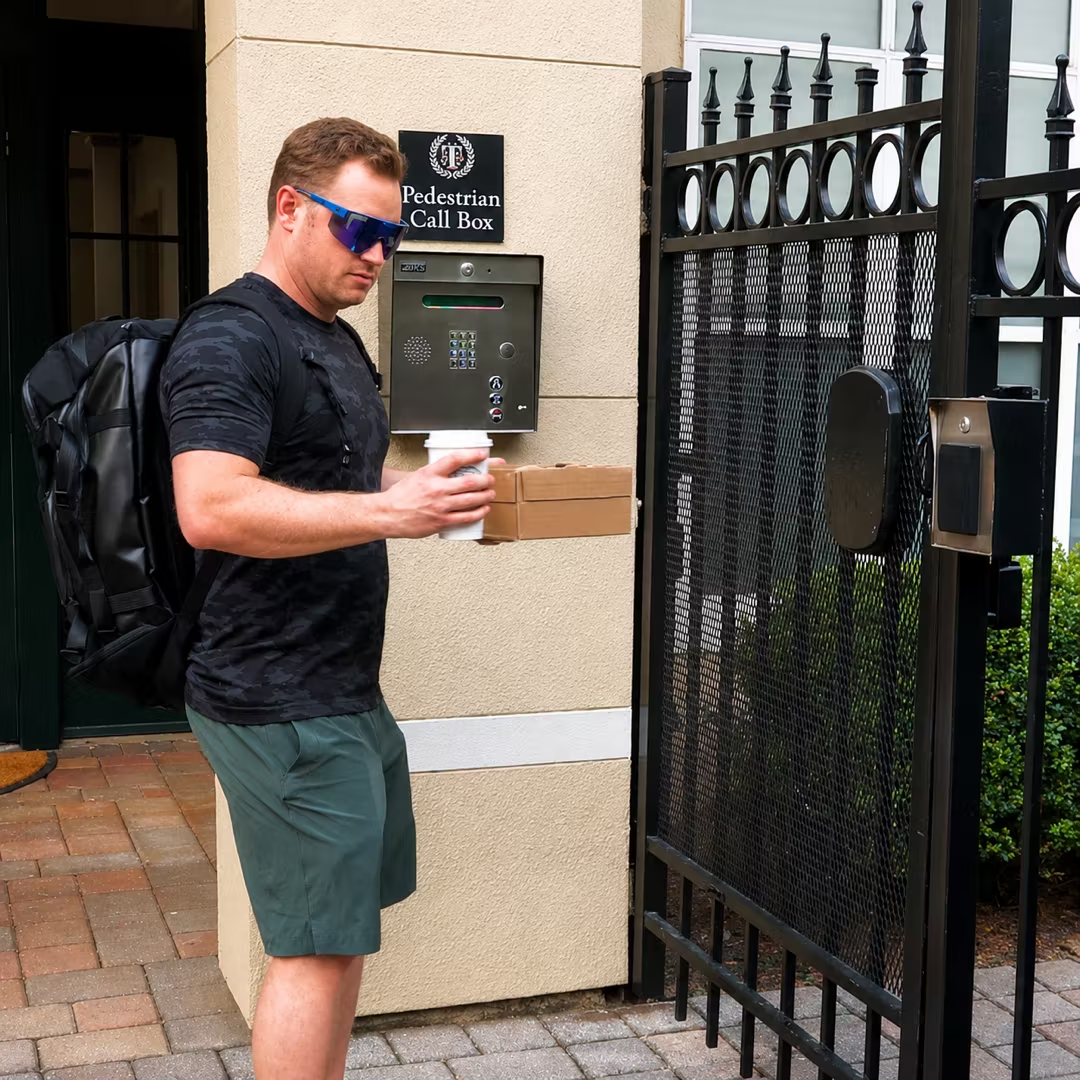
Hands full.
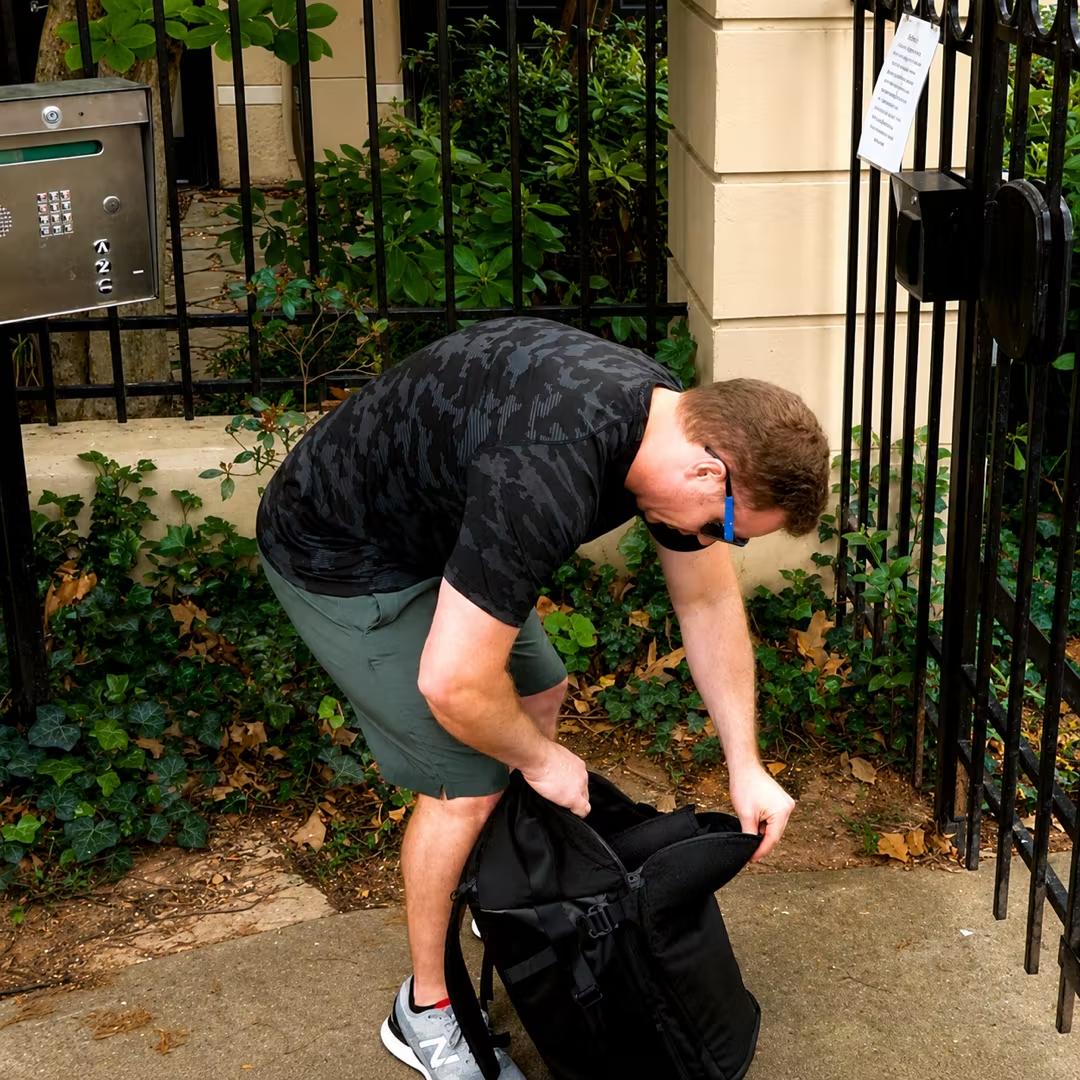
Misplaced.
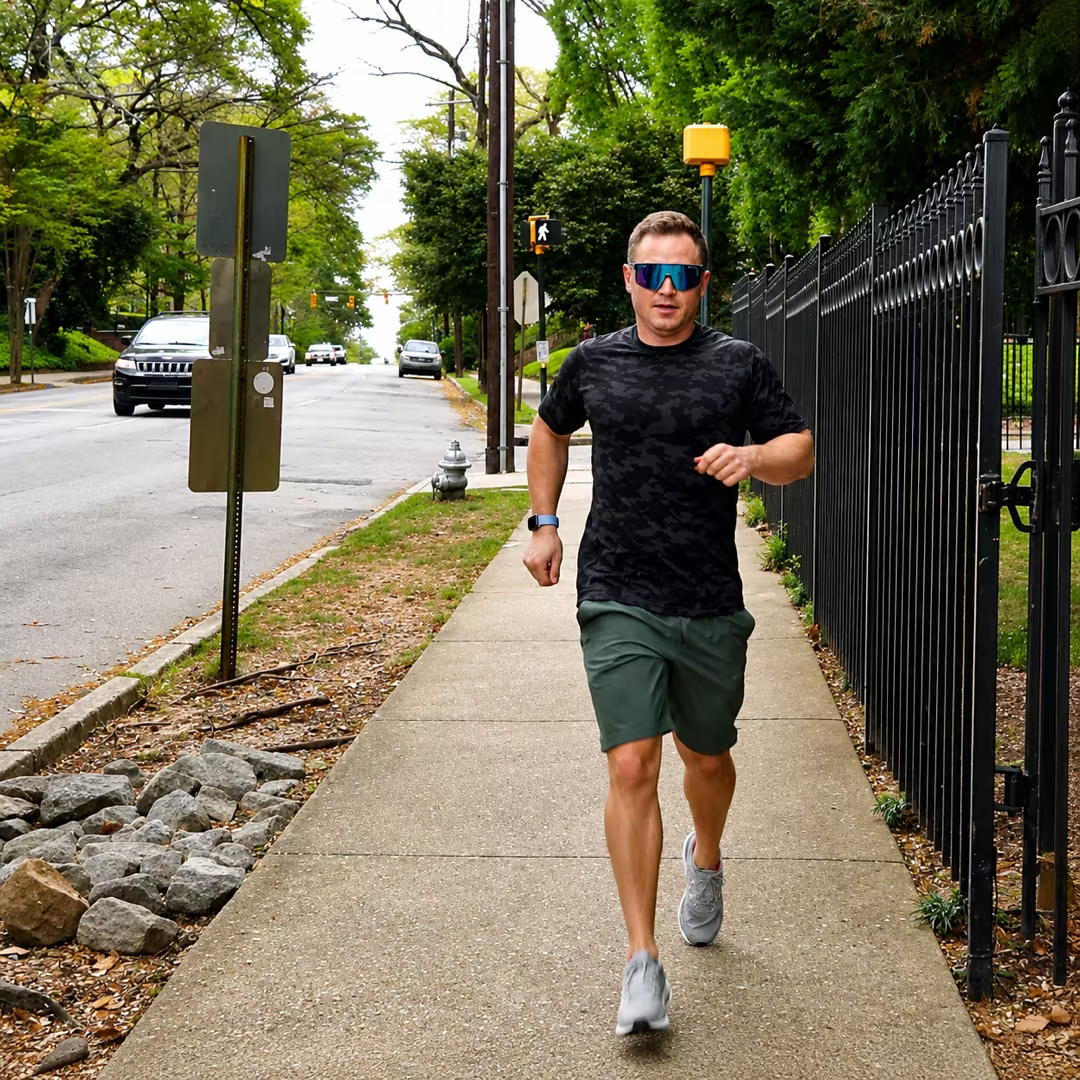
Out for a jog.
Three contexts where the fob fails the wrist: hands full, misplaced, and on the move. The friction is constant, not catastrophic — which is exactly why nobody had fixed it.
The Opportunity
A constant annoyance is also a market failure
Annoyance alone doesn't justify a product, so I went looking for whether the gap was structural. It was. Thirty-six percent of the commercial RFID access market still runs on low-frequency technology from the 1990s. The hardware works just well enough that nobody upgrades — and when facilities managers were asked why they hadn't, the number-one reason wasn't security or capability. It was cost. Inertia, priced in.
The user side was just as fragmented. Most people don't carry one credential — they carry several: the apartment fob, the office badge, the gym tag, each issued by a different building, with no way to combine them. Line those up beside the readers they open and you find no standard, no compatibility, no design — a junk drawer of incompatible plastic. That fragmentation was the opening.
The access market in 2021
36%
of the commercial RFID access market still runs on low-frequency tech from the 1990s.
Cost
is the #1 barrier to upgrading — not security, not capability. Re-equipping a dozen access points can run roughly $100K.
HID Global; commercial access-control industry analysis.

The market as it actually exists: incompatible fobs and cards on one side, a mismatched wall of readers on the other, and no standard linking them. Fragmentation this complete is a vacuum waiting for a category.
Wearable Form Factor
Why the watch band?
Three reasons put the credential on the wrist — and later testing against a phone case and a woven band confirmed the choice.
- 1
Hands Free
A band is hands-free by default. Show up with coffee in one hand and a package in the other, and open the door by turning your wrist to the reader — nothing to dig for, no badge to reach for, no phone to wake.
- 2
Big Market
Roughly 127.5 million smartwatches had shipped in the category, with Apple holding about 30% — a large base already wearing the accessory all day, in exactly the places access happens: the gym, the lobby, the office, the run.
- 3
Tech-Oriented Consumer
A smartwatch owner is precisely the person most put off by a plastic fob running 1990s technology — and the most likely to want building access to feel as current as everything else on their wrist.
Why the wrist
127.5M
smartwatches in the total market — about 30% Apple globally.
Median likelihood to purchase, by form factor
Total smartwatch market; median likelihood-to-purchase from the fobbr study (n=27).

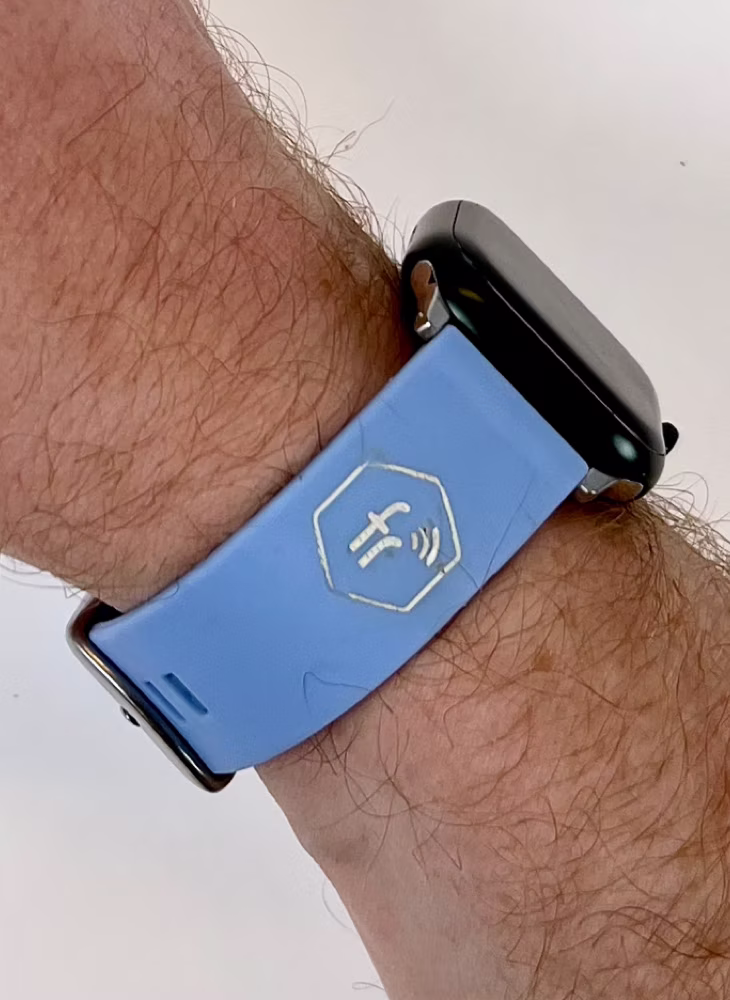
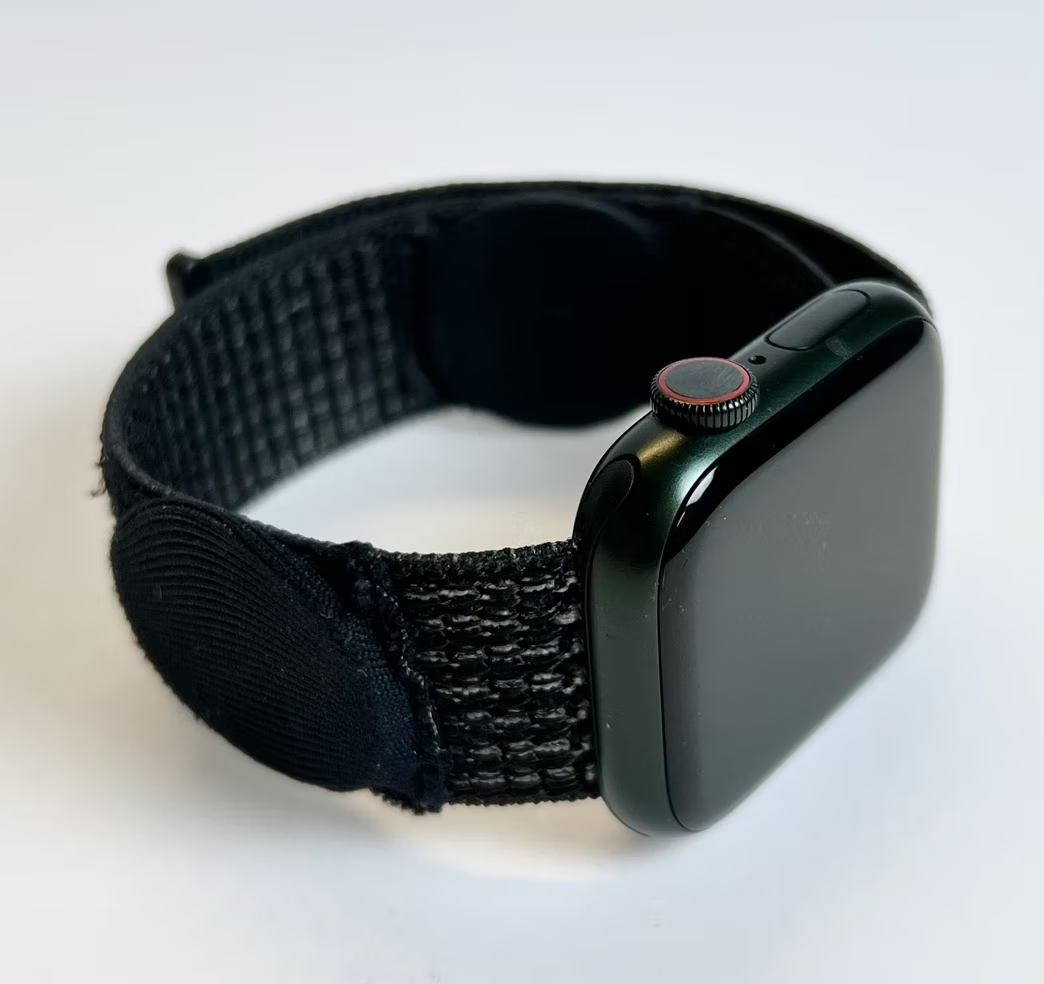
The first prototype: a blue silicone band with the RFID built in and the hexagon mark on the strap. Early, but enough to put the concept on a real wrist and start asking real questions.
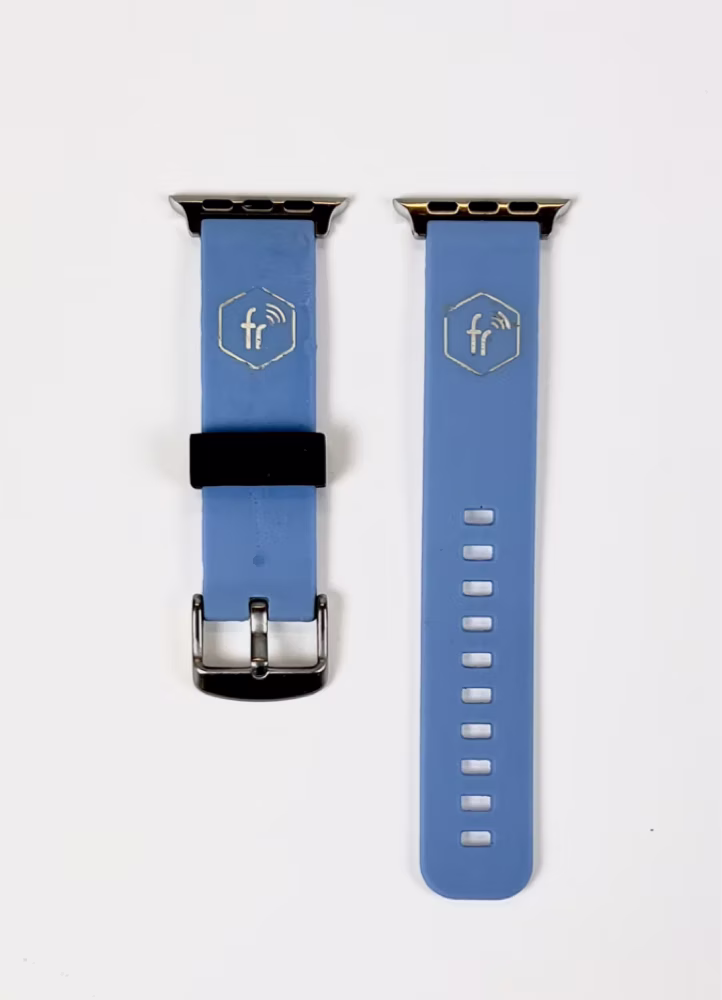
Each hexagon sits over an embedded RFID chip — so the logo doubles as an affordance, showing you where to line up with the reader.
Your hands stay free to reach the access panel. Bonus: use Find My to locate it — never lose your key or badge again.
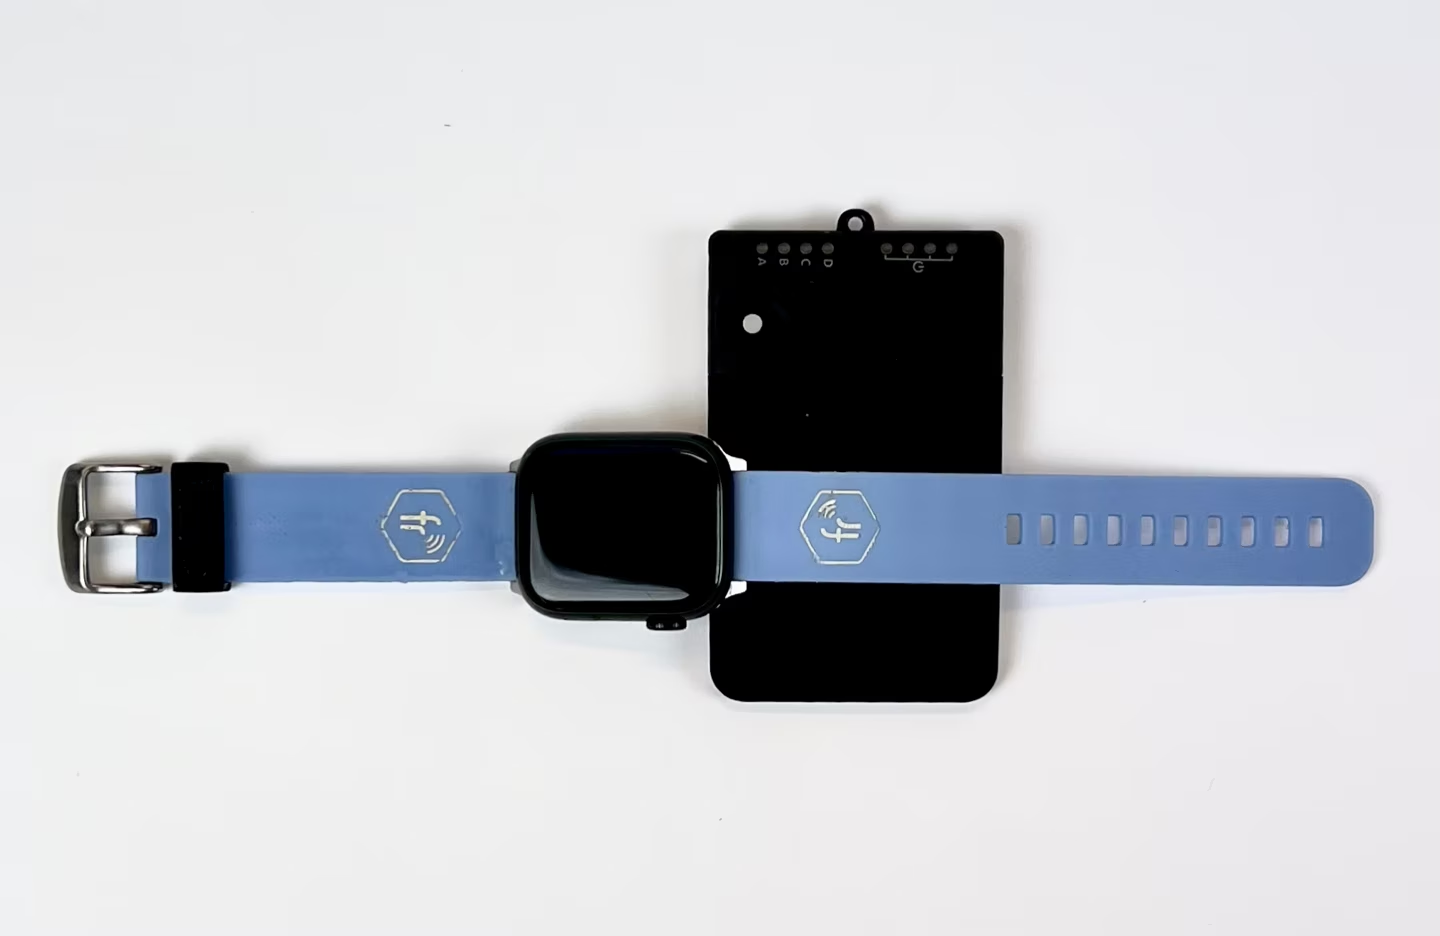
Bench setup: the band paired with the RFID reader used to confirm it actually opened doors.
The Customer
Who fobbr was for
I started from the ideal experience: access that simply happens — hands-free, and fast enough that you never break stride to dig for a fob, peel off a glove, or set down the dog's leash.
From that ideal, three questions followed: what this user values, which real-world groups live that way, and how big the market underneath them actually is.
Traits of the ideal user
Uses RFID access
Values minimalism
Values convenience
Values efficiency
Technology-forward
Has disposable income
Who lives that way

107.8M
Corporate Employees
Time lost at every controlled door adds up — a real ROI case.
82.5M
Apartment Dwellers
Many access points, often reached hands-full: packages, groceries, the dog.

37.5M
College Students
One card for access, payments, and ID — and never enough time.

7.2M
Hospital Staff
Sterile, high-traffic settings where hands-free is speed and safety.
U.S. addressable populations by access-card-carrying group. Sources cited in the thesis.
How big is the market?
6.1M
urban smartwatch owners earning $75K+ — fobbr’s beachhead user. (Urban population × the 20% who wear a smartwatch × the 31% earning over $75K.)
Total — the U.S. smartwatch-accessory market: 61.6M units (2018–2020) × 50% Apple × 3 bands × $50.
Serviceable — the 6.1M target users run through the same per-user logic.
Obtainable — a 3.6% capture, set by the beta's real participation rate, not a guess.
TAM / SAM / SOM for the fobbr band. Method and sources in the thesis.
Study Design
A week-long journal, not a ten-minute survey
The core question wasn't "do people like it" — it was "does the band change behavior," and behavior change can't be measured in a single session. So instead of cramming every question into one end-of-study survey, I built a study that revealed prompts gradually over seven days. Participants journaled about where they used the band, what context changed, what habits shifted, and how it felt as the week went on.
Running that took more than good questions; it took operations. I automated the whole pipeline — Calendly scheduling, a Jotform consent flow, automated Qualtrics journal prompts, and a closing USE survey, NPS, and Van Westendorp pricing study (with Mann-Whitney testing on the results) — so 27 participants could move through a rigorous protocol without it collapsing into chaos. A week-long diary study is harder to run than a survey, and it's the right instrument when the question is whether a habit forms.
Prototype
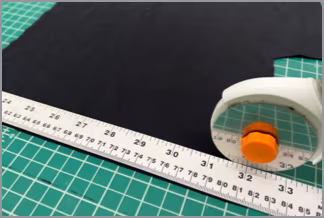
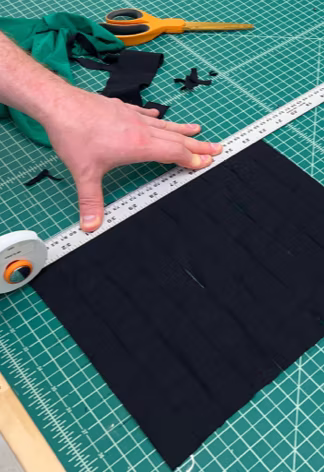
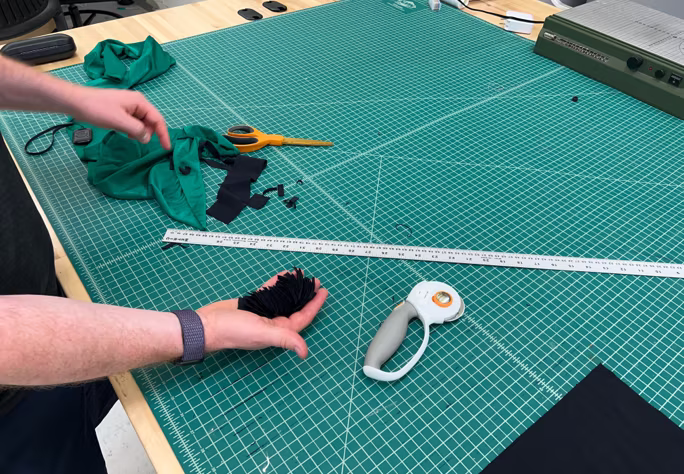
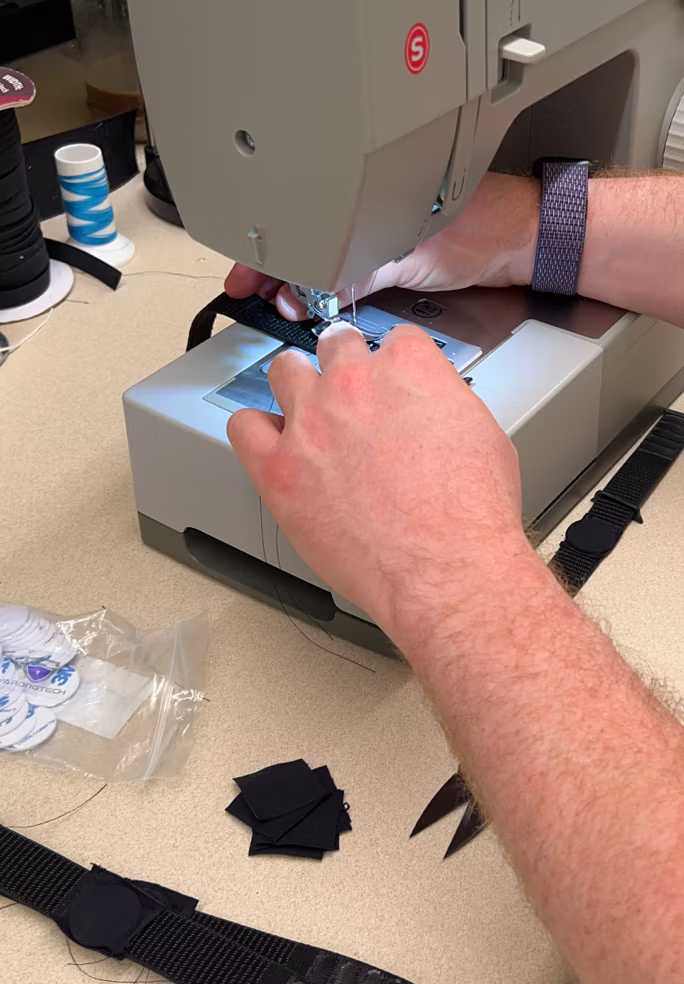
The molds broke. So I built the bands by hand.
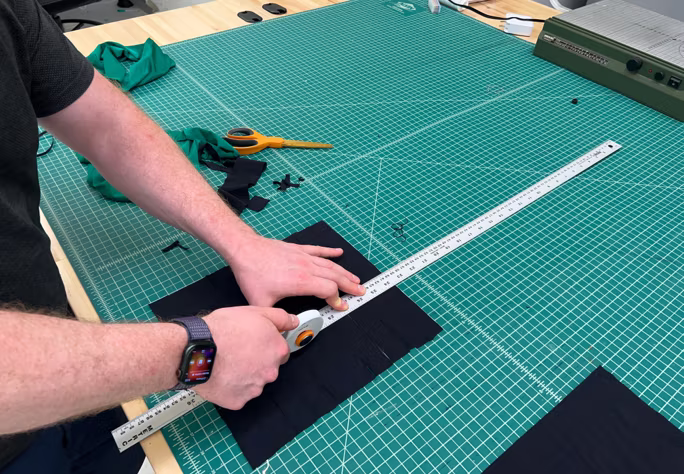
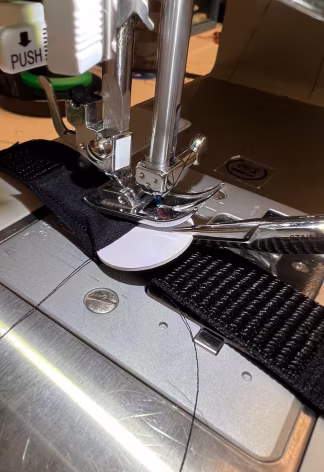
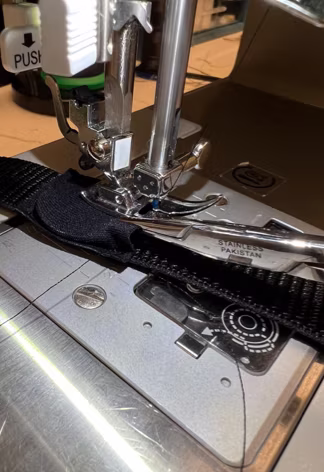
The plan was injection-molded silicone. The molds didn't survive — and waiting on new tooling would have blown the study timeline. So I bought blank nylon bands and hand-sewed RFID chips into each one — two per band, aligned to the left and right of the wrist. Forty units built, twenty-seven into the study. Cut, stitched, and photographed on a folding table.
This isn't a story about resourcefulness as a personality trait. It's a research decision: the study design mattered more than the manufacturing process — and a hand-sewn band answers “does behavior change” exactly as well as a molded one.
Building the beta bands by hand
Cutting the pouches
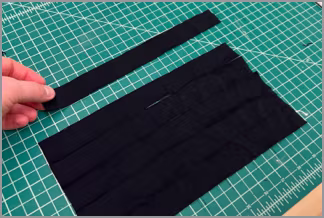
Sewing in the chips
The finished beta bands
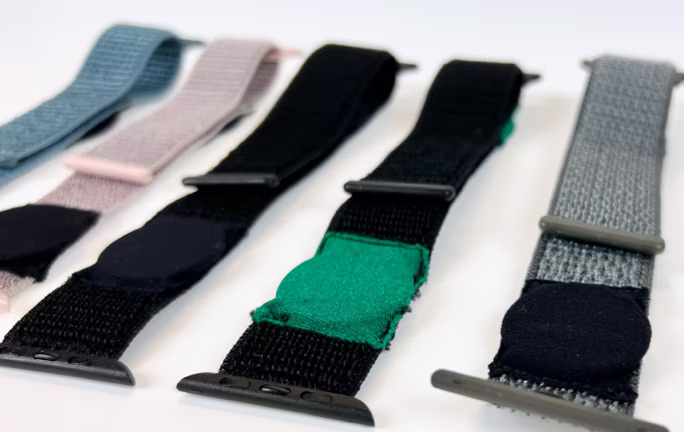
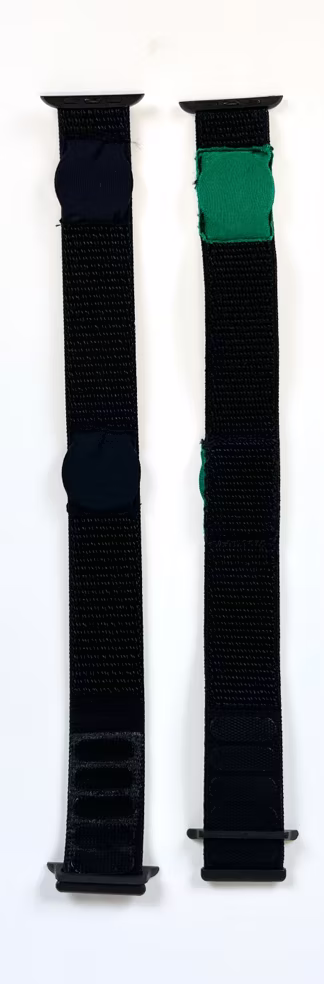
Forty bands, cut and sewn by hand — two RFID chips per band, aligned to the left and right of the wrist.
Study Results
Strong on every measure
46.2
Net Promoter Score
91%
median satisfaction
91%
median usefulness
Reported as medians: the means ran lower (86% / 67%) because responses skewed high — the median reflects the typical user more honestly.
USE survey + NPS — fobbr beta study (n=27).
Behavior Change
They stopped carrying keys — and told me why
By the end of the week, the journals had turned from novelty to habit. People weren't describing a gadget; they were describing a changed routine — lighter pockets, one less thing to lose, the gym and the gate and the front door all handled from the wrist.
“I left my work badge at home in my jacket pocket, and it saved me so much time getting to work using the band.”
— fobbr beta tester — week-long journal study
“I don't carry my elevator keys anymore and wear my [Apple] Watch every day.”
— fobbr beta tester — week-long journal study
“My Apple Watch died one time after a long run, but I was still able to use fobbr because it was part of the band.”
— fobbr beta tester — on the resilience of a passive RFID band
Pricing
You can't run conjoint on a product nobody has seen
Pricing should have been the easy part. It wasn't, because the standard tool didn't apply. Conjoint analysis works by trading features against known alternatives — and fobbr had none. It was pricing a category that didn't exist.
So I used Van Westendorp's Price Sensitivity Meter, which builds an acceptable price range from scratch — four questions about price perception, read from where the cumulative curves cross rather than from an average. Conjoint would have produced confident, wrong numbers; Van Westendorp produced honest ranges for both materials.
The sharpest finding was a bias, not a number. Most testers said the fluoroelastomer was the band they actually wanted — yet they priced the woven higher, because they'd worn the woven beta band all week and the endowment effect inflates whatever you already own. So I trusted the fluoroelastomer's $15–$35 as the truer signal of willingness to pay, and discounted the woven's premium.
Pricing a category of one
Median acceptable price range, by material (Van Westendorp)
Both ranges are medians, read from where the cumulative price curves cross — not from an average. The woven scores higher only because testers wore that band all week: the endowment effect at work.
Van Westendorp median acceptable price range (PMC–PME) — fobbr study (n=27).
Brand
Playful, and quietly magical
fobbr's identity is playful and a little wry, sitting on a quieter promise: the kind of thing that just works — and surprises you with how seamless it is. The system underneath is small and consistent: the hexagonal fr monogram, a palette of fobbr green (#1F8566) with a mid grey, a light grey, and plenty of white, and a warm, plain-spoken voice.
Brand archetype
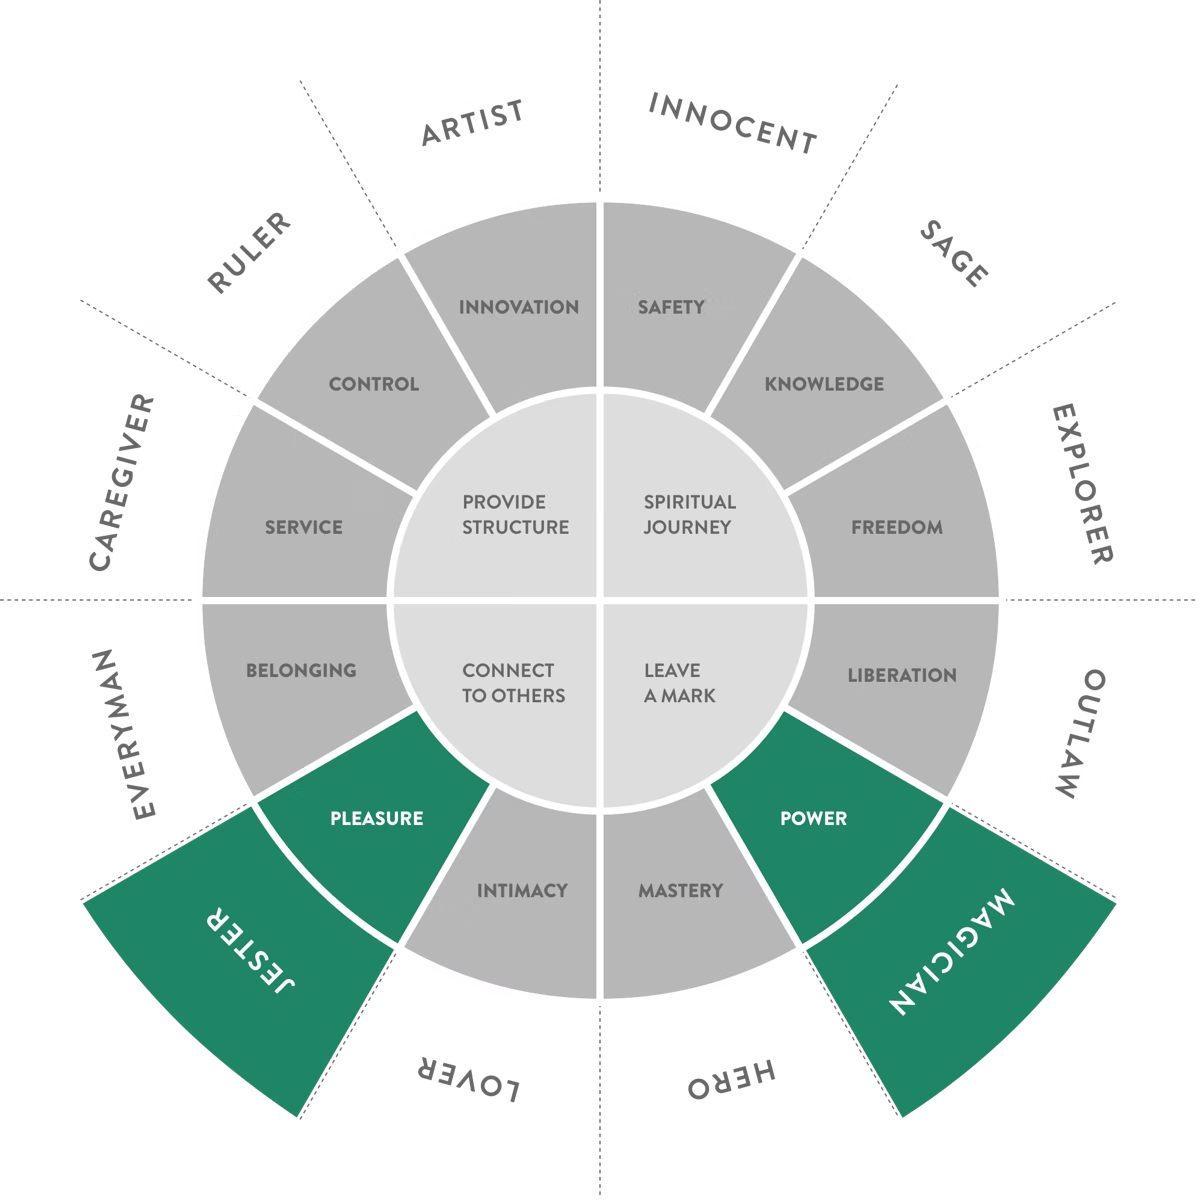
fobbr's personality sits at Jester and Magician — pleasure and power. Playful and human (every email signed 💚 the fobbr team), but promising something genuinely transformative: access that just happens.
The mark


The wordmark and mark are constructed on the Fibonacci sequence — proportion with a reason, not a flourish.
The palette
fobbr green
Logo · titles
#1F8566
Pantone 3288 U
Mid grey
Headers · body
#676767
Pantone 426 U
Light grey
Aux
#B7B7B7
Pantone Cool Grey 4 C
White
Space
#FFFFFF
Pantone 11-0700 TPG
The Product
One band, nine ways, ready for a shelf
What shipped from two years of research and iteration was a complete product, not a prototype: a fluoroelastomer band in nine colorways, the RFID built in rather than bolted on, photographed and merchandised as if it were already on a store wall.
Nine colorways


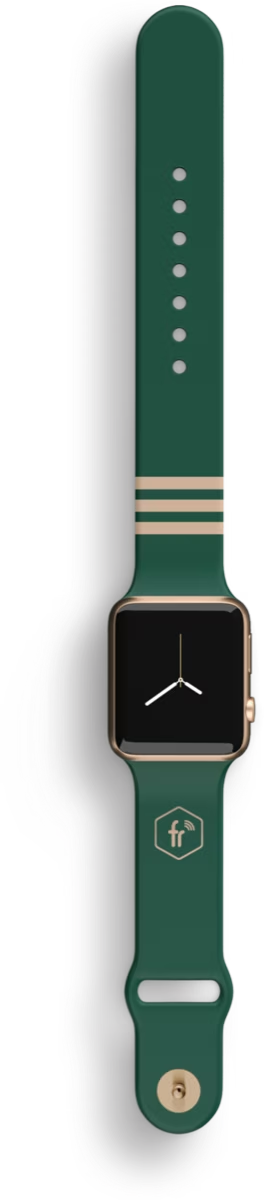


One band, nine ways — the fluoroelastomer range, RFID built in.

Hands full at the gate — open it with a turn of the wrist.
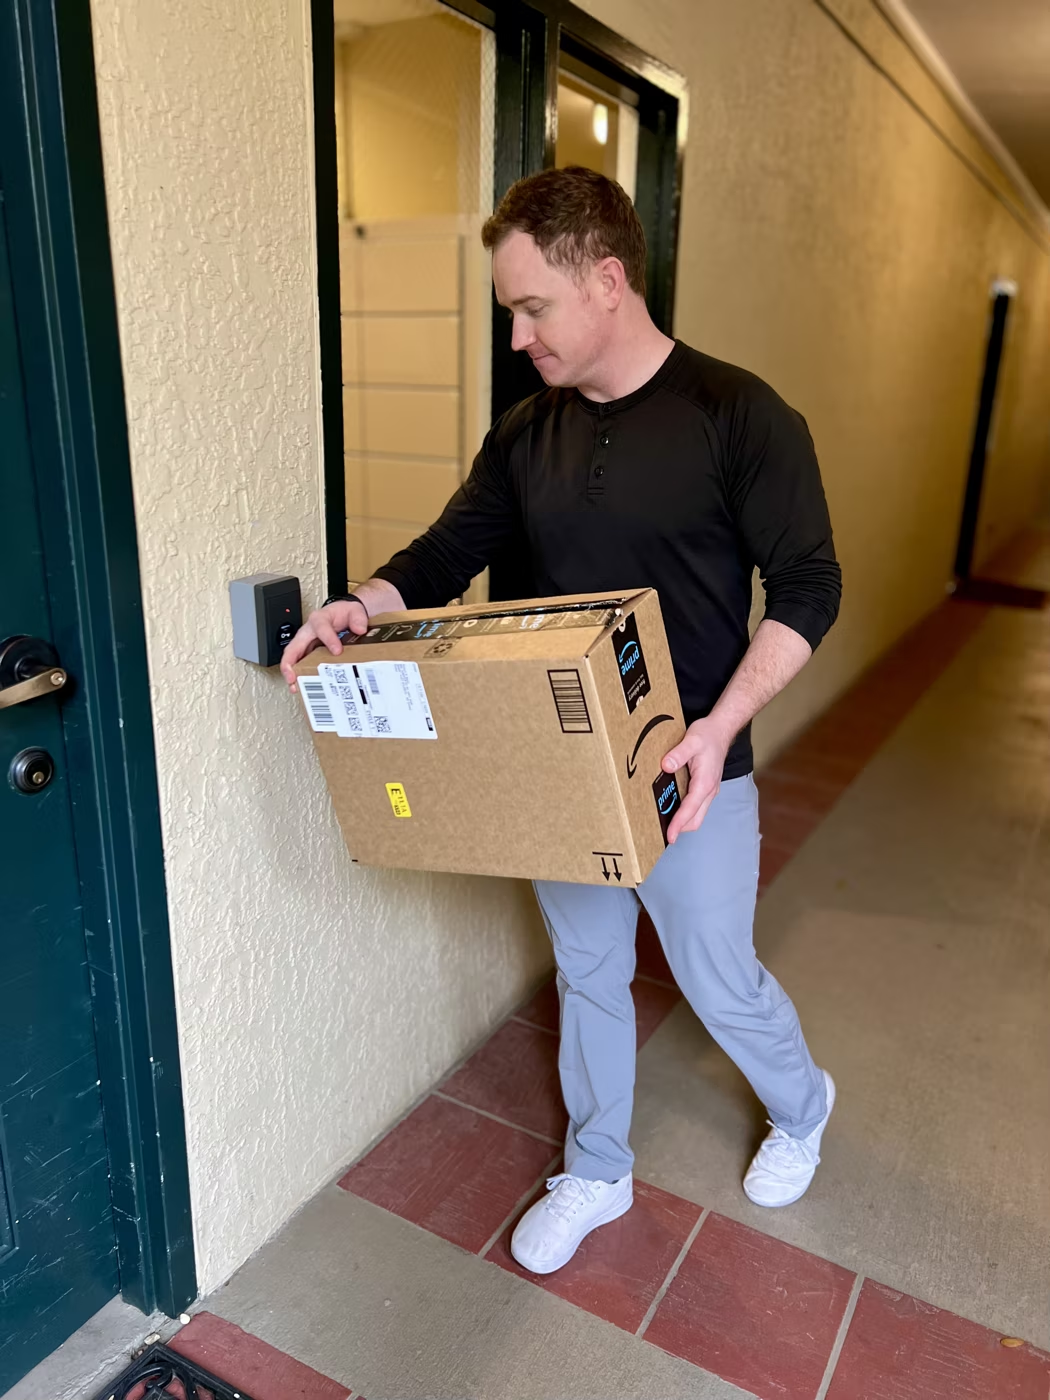
A package in both arms — the door still opens.
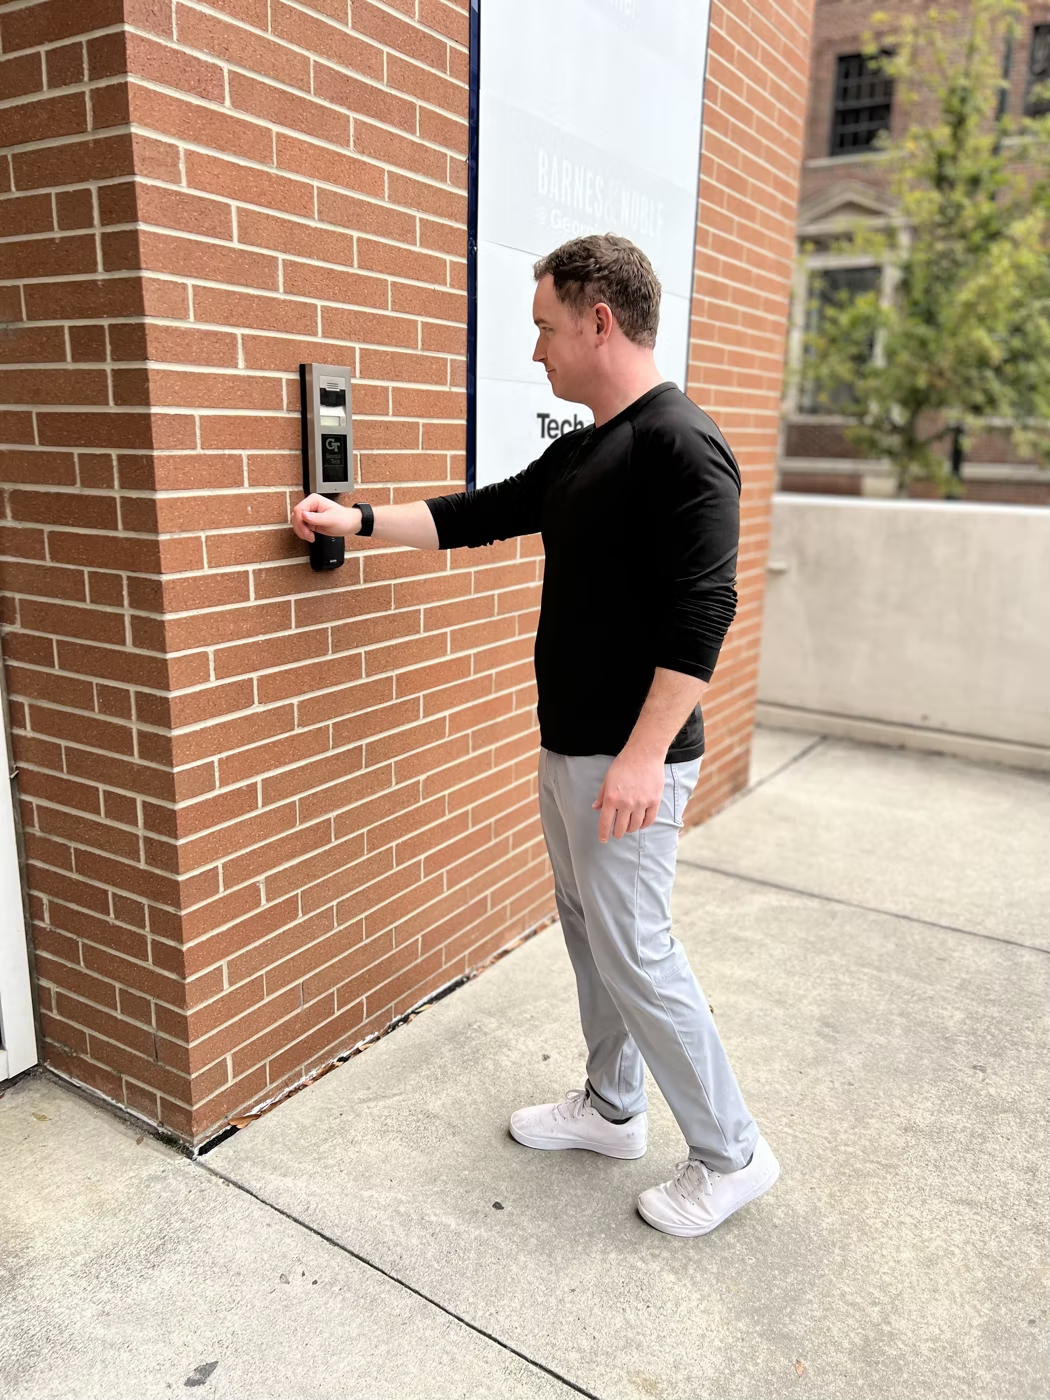
Tap and go, badge-free.
The friction from the opening, resolved: every door from the wrist — hands full or not.

The brand in the world — fr, access point ahead.
What Shipped
46.2
NPS (beta study)
91%
Satisfaction (USE, median)
$15–$50
Validated price range
27
Study prototypes
On the USE survey, median satisfaction and usefulness both landed at 91% — reported as medians because the responses skewed high. NPS of 46.2. Won 1st prize at the Convergence Innovation Competition — the entry into Georgia Tech's Create-X startup incubator, which fobbr graduated. The beta was also a go-to-market step: it pointed toward a Kickstarter launch, with the beta cohort positioned as fobbr's first early adopters. Award: https://research.gatech.edu/ipat/cic/spring-2021/fobbr
- USE survey: median satisfaction and usefulness both 91% (means 85.8% / 67.3% — the distribution skewed high, so the median better reflects the typical user)
- NPS: 46.2 (53.8% promoters, 7.7% detractors)
- Won 1st prize at the Convergence Innovation Competition — entry into Create-X
- Graduated from Georgia Tech's Create-X startup incubator
What I Learned
fobbr is a project where I was every department. I pulled RFID credentials off a Proxmark, built the study operations, ran the pricing economics, sewed the prototypes, shot the product, and drew the brand — because there was no one to hand any of it to.
Doing everything also meant nothing reached full depth. That range is the thing I'm proudest of and the thing I'd change. At Staff scale the job isn't to be every department — it's to hold the whole-system view while a team takes each layer further than one person can.
Being every layer taught me how the layers constrain each other. A pricing instrument is only as good as the study that feeds it, and a brand is only defensible when it's rooted in the same material as the product. fobbr taught me to see the system; the next step is leading it.
What this demonstrates
More Work
All projects →